Knowledgebase: Information and Support for Instructors > Instructor Tools
|
Instructor tools: 6) Analytics
|
|
|
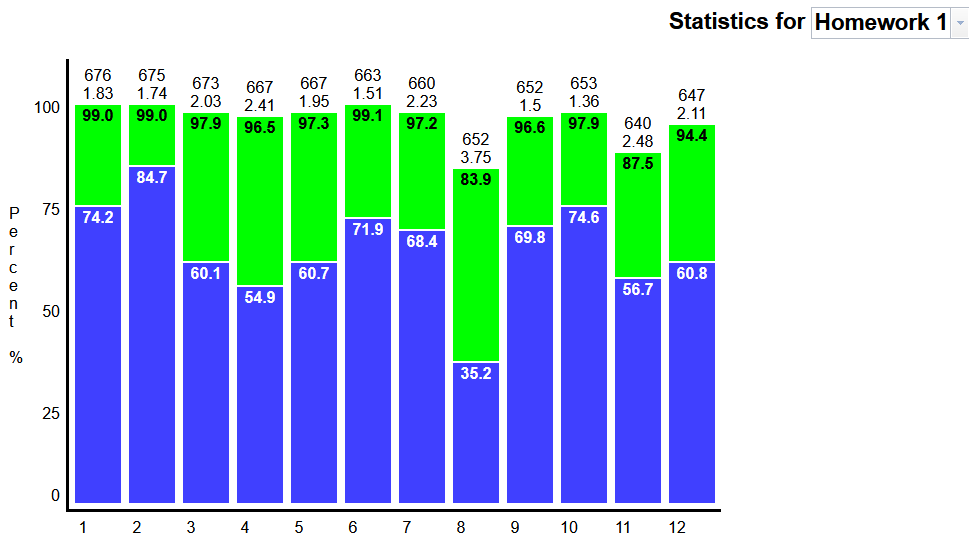
The Analytics page provides graphs that summarize the overall class performance for each question, in each selected assignment. An example is illustrated below. The numbers at the top of each column are the number of students who have attempted the question, followed by the average number of attempts per student on that question. The top of the green bar is the average of the best grades recorded for each student. The top of the blue bar is the average of all attempts made by students on the question. If these values are the same no green bar will be visible. The averages are taken over all students in the class who have attempted the question at least once. | |
|
|